
Table of Contents
Introduction
Did your website traffic just fall off a cliff? Don’t panic. Diagnose it.
In May 2025, I checked my Google Search Console (GSC) and my stomach dropped. My indexed pages had plummeted from over 500 to near-zero in a matter of days. I assumed I had been hit by a massive Google Core Update penalty. I spent weeks rewriting content, only to discover the real culprit: a silent DNS configuration error during a server migration. Googlebot simply couldn’t reach my site.
When traffic drops, website owners often panic and start changing things they shouldn’t. You need to know exactly why your traffic dropped before you try to fix it. Is it a technical blackout? An algorithmic Helpful Content penalty? Or just a seasonal trend?
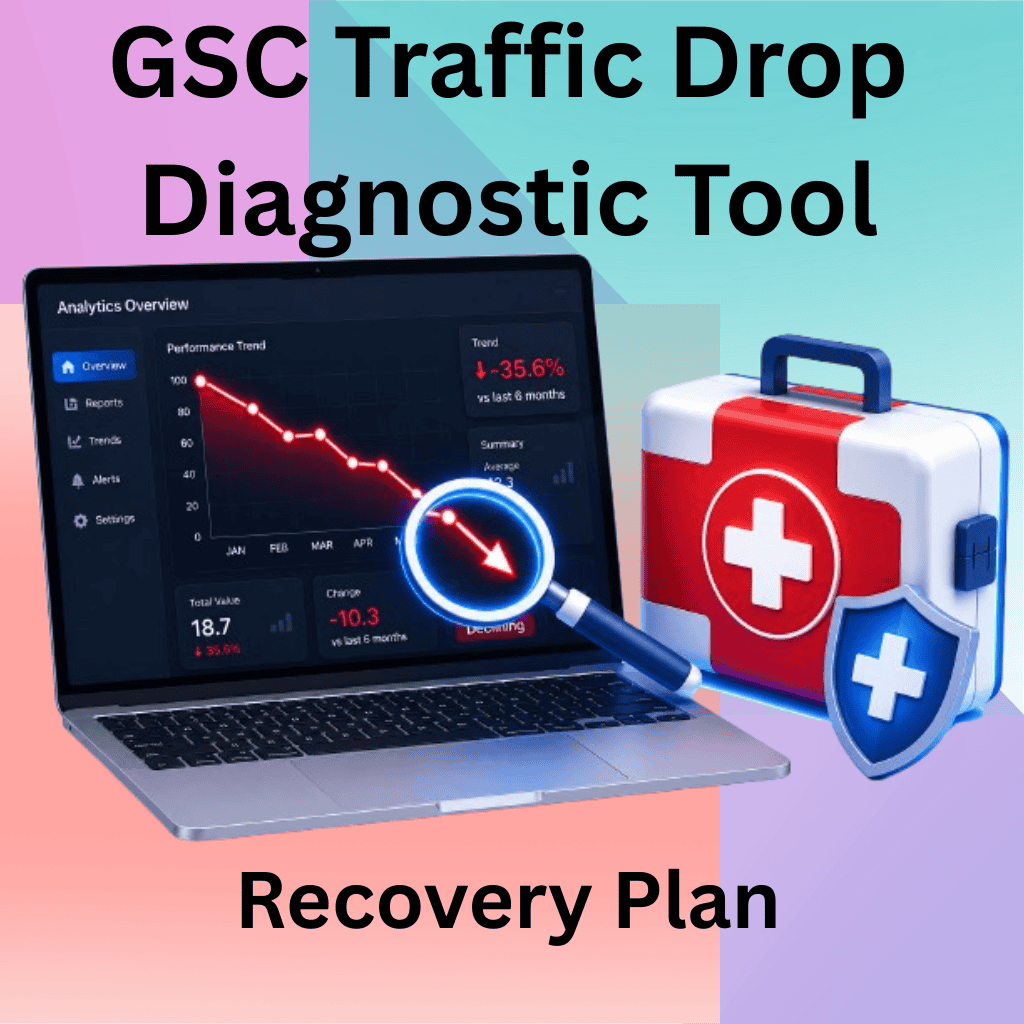
This enterprise-grade, client-side diagnostic tool acts as your personal Technical SEO investigator. You don’t need to give us API access to your Google account. You simply copy and paste the raw text from your Google Search Console dashboard, and our browser-based engine will parse the data, visualize the damage, and give you a definitive diagnosis.
How to Use the GSC Traffic Drop Diagnostic Tool
This tool uses a step-by-step wizard. You can skip any section you don’t want to analyze, but the more data you provide, the more accurate the diagnosis.
- Step 1: Performance Data: Go to GSC > Search Results. Copy the table showing your Dates, Clicks, and Impressions, and paste it in.
- Step 2: Indexing Errors: Go to GSC > Pages. Scroll down to “Why pages aren’t indexed.” Copy that entire table (e.g., “Crawled – currently not indexed”) and paste it in.
- Step 3: Analyze: The tool’s Web Worker will process your messy text data in the background, generate visual charts, and cross-reference your symptoms to give you a step-by-step recovery plan.
Stop guessing. Paste your GSC data below and find out exactly what happened to your traffic.
The GSC Traffic Drop Diagnostic Tool
GSC Deep Forensic Drop Triager Engine
📊 Stage 1: Performance Matrix Stream (Clicks & Impressions)
Navigate to Google Search Console > Performance > Search Results. Select your timeframe, click export, or select and copy the data rows directly off your viewport graph and paste them below:
🗂️ Stage 2: Universal Indexing Disconnection Array
Navigate to Google Search Console > Indexing > Pages. Scroll down to the table labeled ‘Why pages aren’t indexed’. Select and copy the entire rows of data and paste them below:
Execute Algorithmic Forensic Compilation
Our background processing thread reads your raw metrics data streams locally inside your browser framework. Data payloads are entirely wiped upon closing the tab context.
📋 Custom Remediation Mapping
⚡ Is Core Web Vitals Latency Sabotaging Your Crawl Allocation?
Severe style sheet sizing locks, input processing lags, and low server execution parameters block crawling processes across target domains.
Launch Core Web Vitals Planner ➔